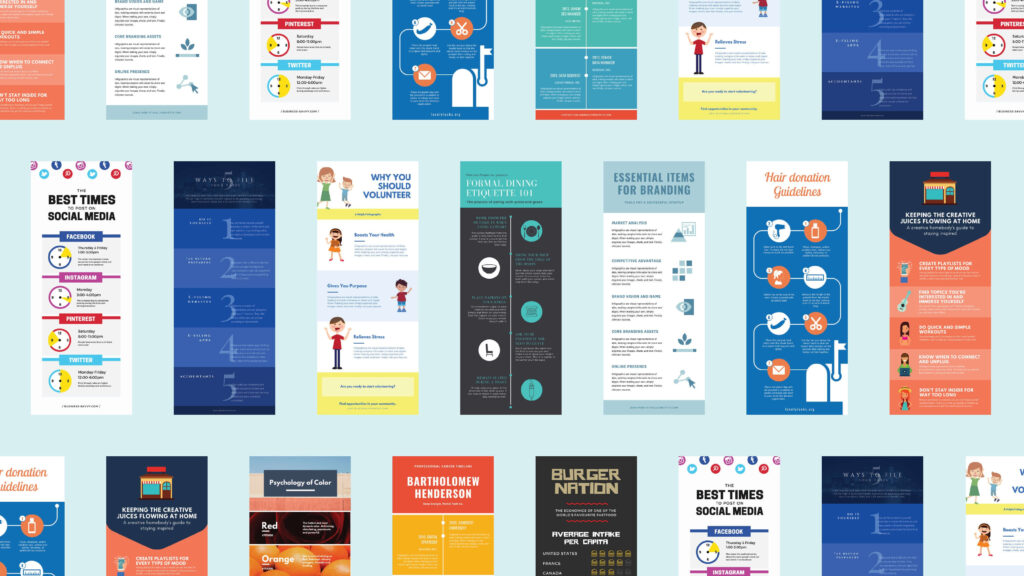
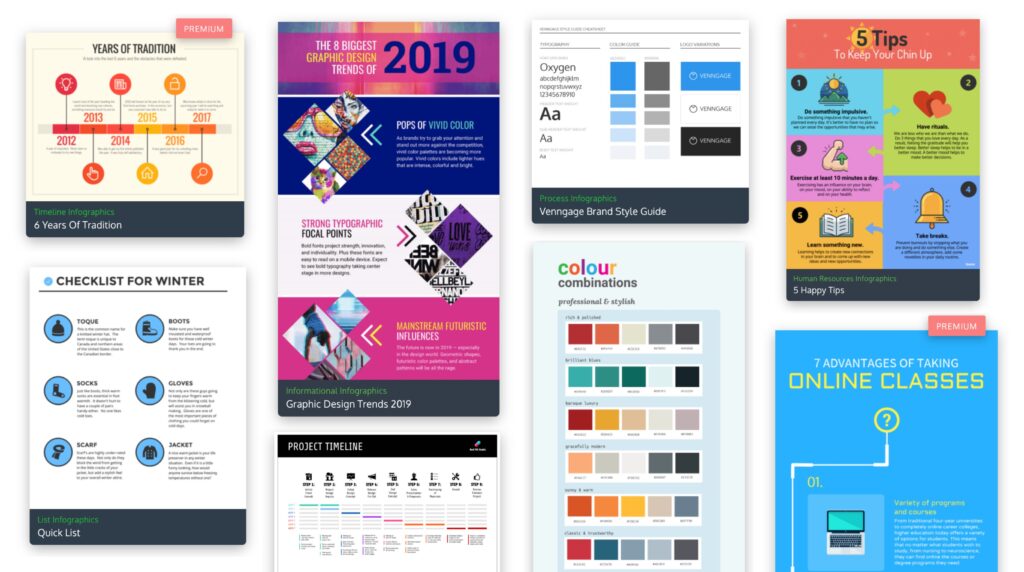
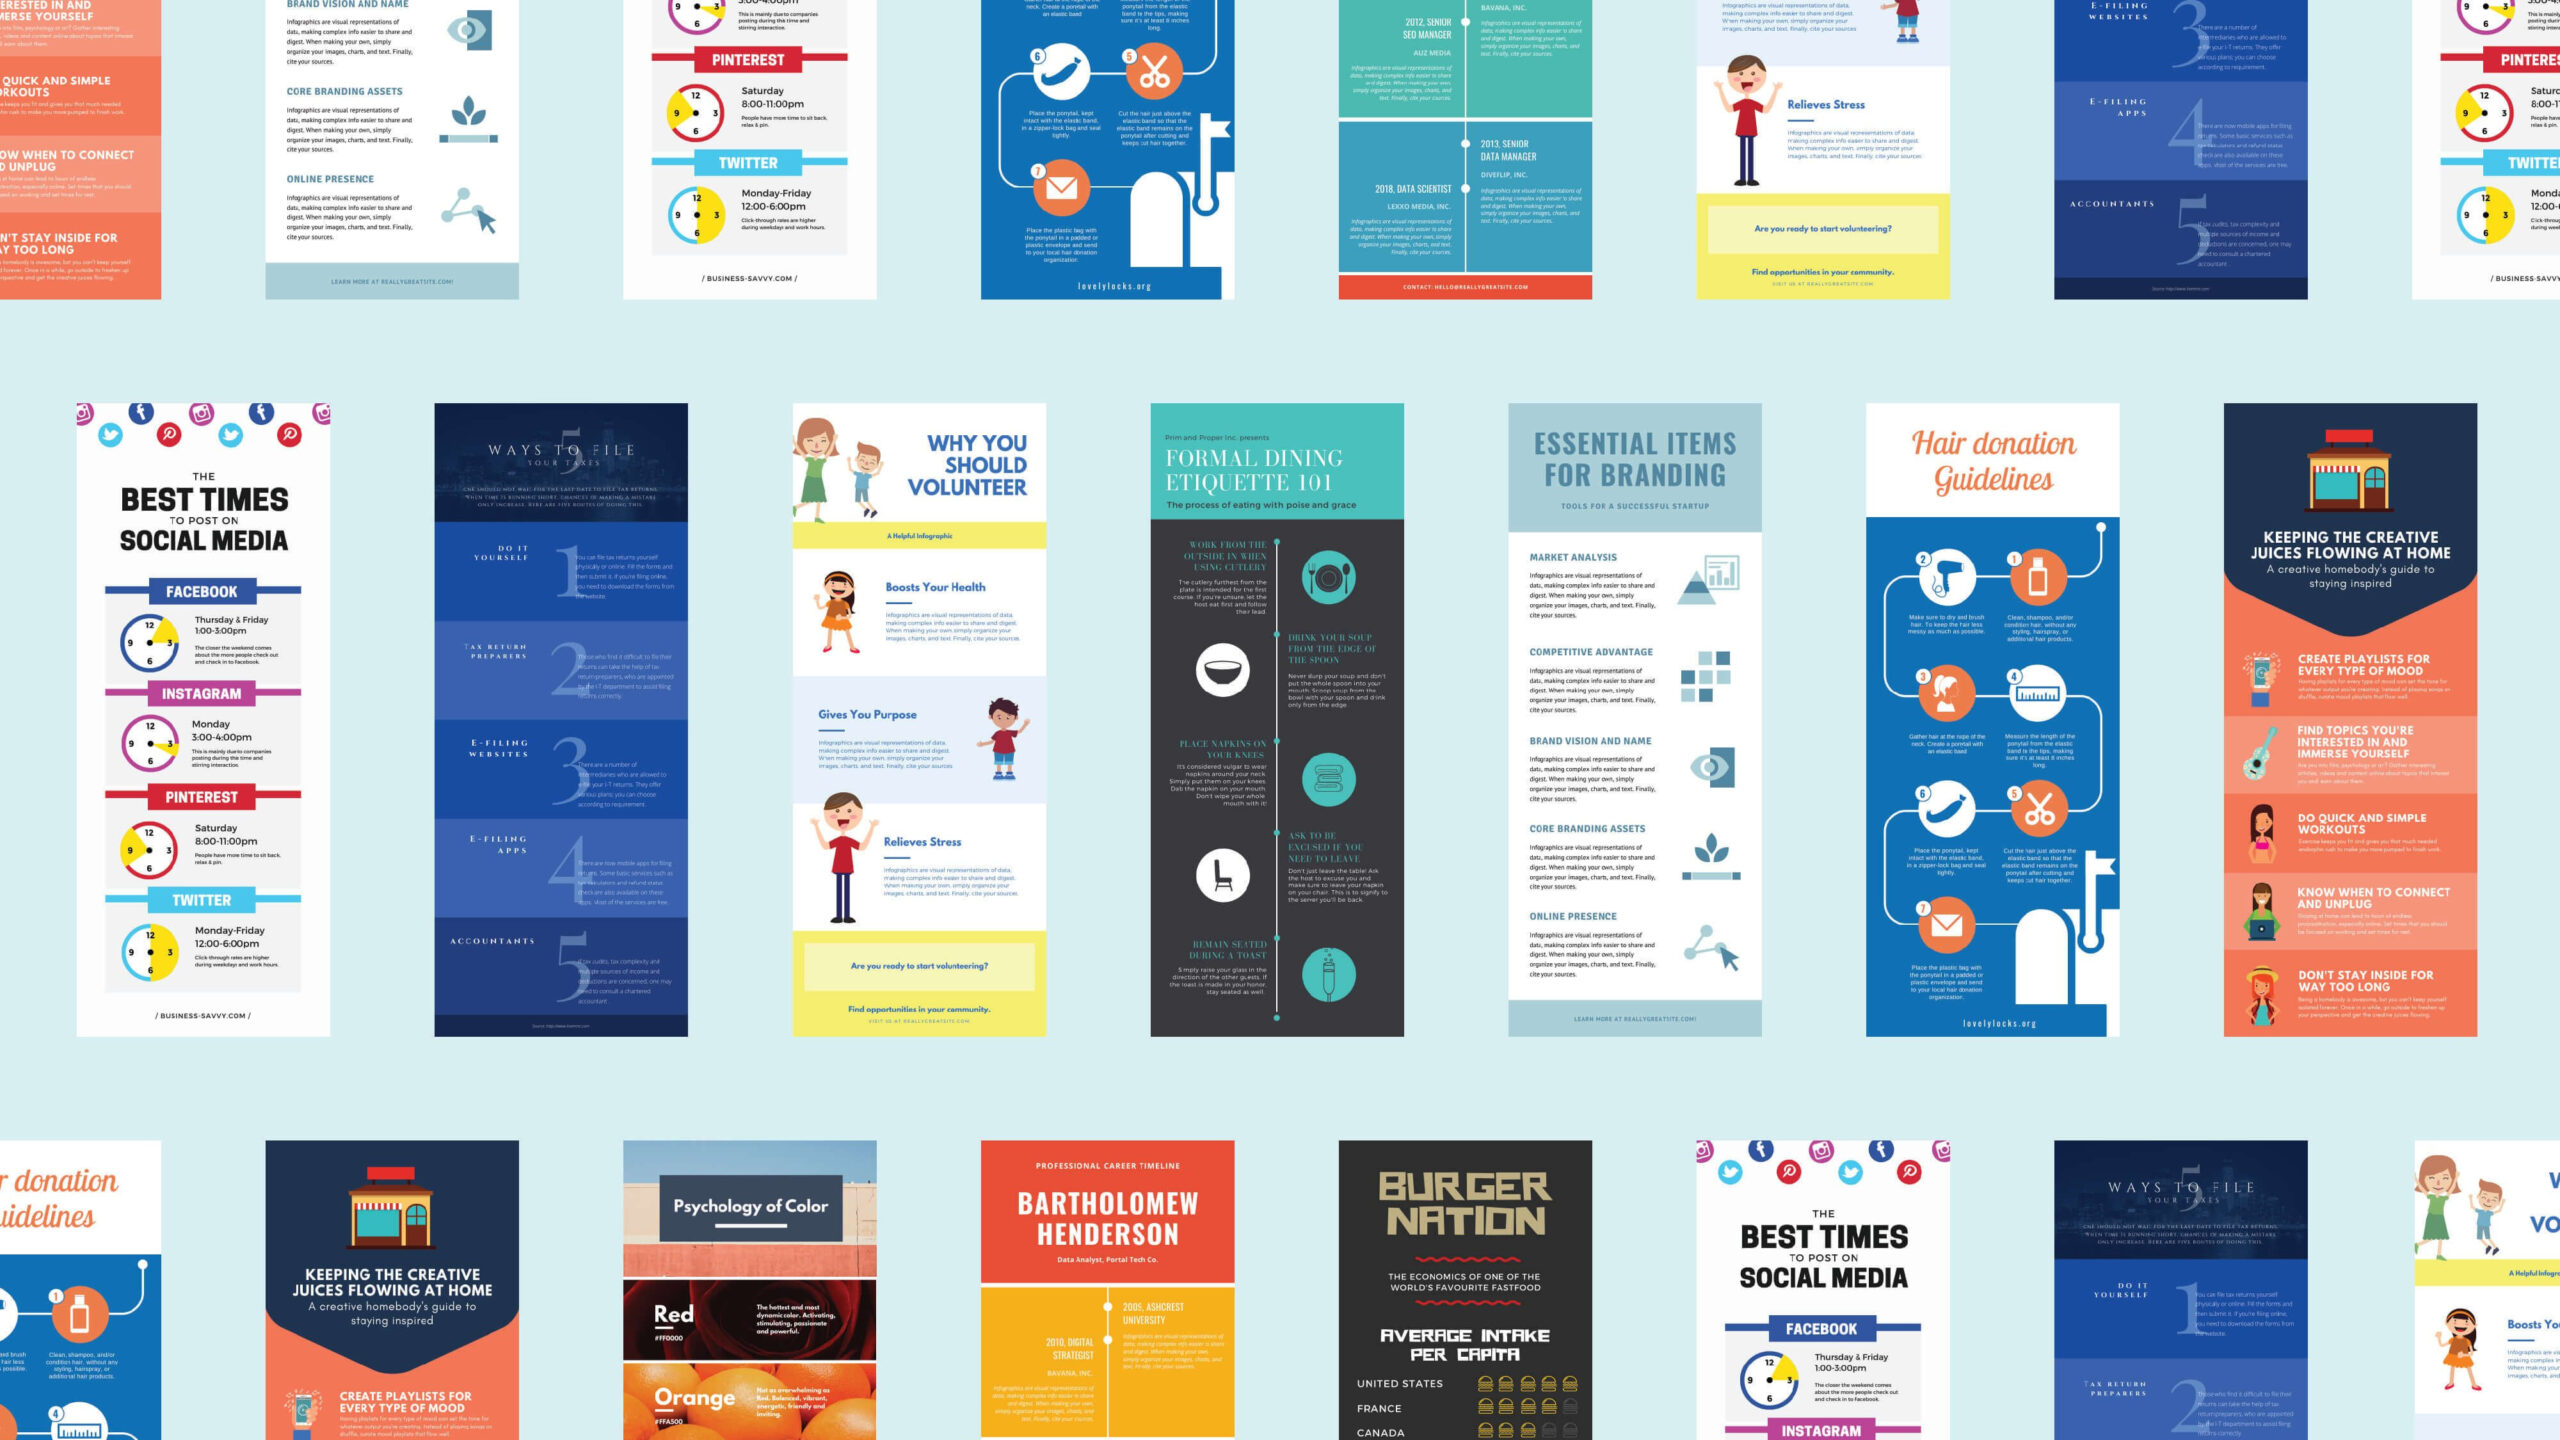
Infographics have become an increasingly popular and effective way to present complex information in a visually appealing and easily digestible format. These visually compelling graphics combine text, icons, and illustrations to convey information quickly and effectively. In this article, we will explore key tips for designing effective infographics that engage your audience and effectively communicate your message.
I. Define Your Objective and Target Audience:
Before creating an infographic, it’s important to clearly define your objective and identify your target audience. The objective sets the purpose and goal of your infographic, whether it’s to educate, inform, entertain, or persuade. Understanding your target audience is essential to tailor the content and design to their preferences, interests, and needs. Consider their demographics, psychographics, and knowledge level to create an infographic that resonates with them and effectively communicates your message.
II. Plan and Organize Your Content:
To create a well-structured and effective infographic, break down your content into key points or sections that can be effectively represented visually. Each section should focus on a specific idea or concept. Consider the flow and order of information to ensure a logical and coherent structure. By organizing the content, you can guide the viewer’s understanding and make the infographic more digestible and engaging.

III. Choose an Appropriate Design Style:
The design style of your infographic plays a crucial role in capturing attention and conveying information. It should align with your brand identity and effectively communicate your message. Consider the tone, aesthetics, and visual elements that will resonate with your target audience. Choose color schemes, typography, and icons that enhance the visual appeal and readability of the infographic, while maintaining consistency with your brand’s visual identity.
IV. Use Visual Elements to Enhance Understanding:
One of the key advantages of infographics is their ability to present complex information in a visually engaging manner. Utilize charts, graphs, icons, and illustrations to visualize data, statistics, and concepts. These visual elements simplify complex information and make it easier to understand. Ensure that the visual representations are clear, concise, and accurate, supporting the information you’re conveying and adding visual interest to the infographic.

V. Keep It Simple and Clear:
While infographics are meant to simplify information, it’s important to avoid overwhelming the viewer with too much content or unnecessary visuals. Keep the text concise and impactful, supporting the visuals and conveying the main points effectively. Use clear and straightforward language to enhance comprehension. Strive for simplicity in both design and content to maintain clarity and make the infographic accessible to a wider audience.
VI. Pay Attention to Layout and Visual Hierarchy:
The layout of your infographic greatly influences how information is perceived and understood. Organize the content in a logical and intuitive flow, guiding the viewer’s eye from top to bottom or left to right. Use visual cues such as size, color, and placement to establish a hierarchy and emphasize key points. This helps viewers navigate the infographic, directing their attention to the most important information first. Proper visual hierarchy ensures that the infographic is both visually appealing and easy to comprehend.

VII. Make It Shareable and Mobile-Friendly:
In today’s digital landscape, it’s important to optimize your infographic for shareability and mobile devices. Ensure that the infographic is easily shareable on social media platforms, with buttons or links that allow users to distribute it easily. Consider the dimensions and file size to ensure that the infographic displays properly and is visually appealing across different devices and screen sizes. By making it shareable and mobile-friendly, you can increase its reach and engagement.
VIII. Test and Iterate:
To create an effective infographic, it’s crucial to gather feedback and make iterative improvements. Seek feedback from colleagues, target audience members, or design experts to gain different perspectives and identify areas for enhancement. Conduct user testing to assess the readability, comprehension, and overall impact of the infographic. Based on the feedback received, make necessary revisions to refine the content, design, or layout. Testing and iterating ensure that your infographic effectively communicates your message and engages your target audience.
In conclusion, designing effective infographics is a powerful way to present complex information in a visually engaging and easily understandable format. By following the key tips outlined in this article, you can create infographics that effectively communicate your message, engage your audience, and leave a lasting impact. Remember:
- Define your objective and target audience to ensure your infographic aligns with your goals.
- Plan and organize your content to present information in a logical and structured manner.
- Choose an appropriate design style that reflects your brand and effectively communicates your message.
- Use visual elements such as charts, graphs, icons, and illustrations to enhance understanding and engagement.
- Keep your infographic simple and clear, avoiding clutter and focusing on the key points.
- Pay attention to layout and visual hierarchy to guide the viewer’s attention and emphasize important information.
- Optimize your infographic for shareability and mobile-friendliness to maximize its reach.
- Test and iterate to refine your infographic based on feedback and ensure its effectiveness.
Contact us if you have any questions or require support!

Leave a Reply